
This guide explains how to prepare your CRM data, configure the necessary properties, and create the HubSpot reports you need to measure:
- Deal velocity and time-to-close
- Win rate for AI-assisted deals
- Revenue per rep and efficiency gains
- Pipeline contribution
- Cost savings and AI ROI
You will then bring these reports together in a dedicated AI ROI and RevOps dashboard, giving stakeholders one reliable view of how AI is influencing revenue performance.
Before you begin:
Most of the HubSpot reporting workflows in this guide require:
- A HubSpot Professional or Enterprise subscription
- Access to the custom report builder
- Permission to create, own, and edit reports
- Permission to create or edit dashboards
- Consistent deal, lifecycle, and revenue data
The exact reporting tools available will depend on the HubSpot products and subscription levels in your portal.
Setting up the foundational HubSpot data
A reliable HubSpot RevOps dashboard starts with the data behind it.
If deal stages are outdated, amounts are missing, or teams apply different definitions to the same field, even a technically correct report will produce misleading results.
Before creating your reports, confirm:
- What each metric means
- Which records will be included?
- Which reporting period will be used?
- Who owns the source data?
- How will AI involvement be identified?
- Which team is responsible for maintaining each property
Step 1: Create custom properties to track AI usage
Start with a few properties that your teams can update consistently. For the AI-Assisted Deal property, a dropdown with Yes, No, and Unknown is more useful than a single checkbox.
|
Property |
HubSpot Object |
Recommended Field Type |
Purpose |
|
AI-Assisted Deal |
Deal |
Dropdown: Yes, No, Unknown |
Identifies deals where AI supported the sales process |
|
AI-Generated Lead |
Contact or lead |
Dropdown: Yes, No, Unknown |
Identifies leads generated through AI-supported activity |
|
Estimated Hours Saved |
Deal or relevant object |
Number |
Supports efficiency and cost-saving calculations |
|
AI Costs Allocated |
Deal or relevant object |
Currency |
Records the AI cost allocated to the deal or activity |
|
Estimated Cost Saved |
Deal or relevant object |
Currency |
Captures the estimated financial saving |
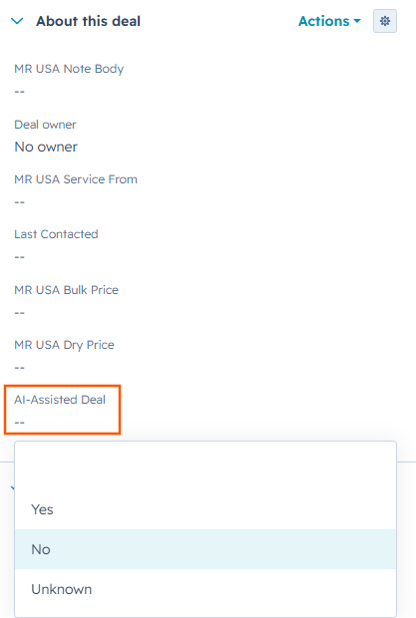
Example of an AI-assisted deal property used to identify AI-influenced opportunities.
Define what counts as AI-assisted
Add a clear description to the property so everyone applies it consistently.
For example:
Select Yes when AI directly supported a meaningful part of the deal process, such as prospecting, research, qualification, outreach, content creation, forecasting or summarisation.
| 💡 Avoid classifying every deal as AI-assisted simply because the sales representative had access to an AI tool. The property should indicate that AI was actually used in the process being measured. |
Create the properties in HubSpot
Create these as custom properties on the relevant HubSpot objects, then add them to the record views, pipeline stages or workflows where your teams will use them.
For detailed setup instructions, see HubSpot’s guide to creating and editing properties.
|
💡 Where possible, automate property updates using workflows or integrations. Reserve manual fields for information that genuinely requires human judgement. |
Step 2: Align your pipeline data
At minimum, ensure the following fields are completed:
- Deal amount
- Close date
- Deal stage
- Deal owner
- Pipeline
- AI-Assisted Deal
- Associated contact or company
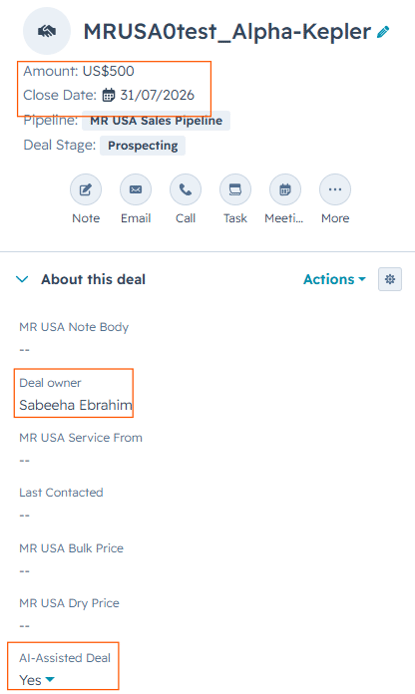
Required deal properties help ensure the data used in velocity and ROI reports is complete.
Step 3: Align your HubSpot lifecycle stages
HubSpot lifecycle stages help marketing, sales, and customer success understand where contacts and companies sit in the wider customer journey.
Document the entry criteria, owner, and required actions for each stage.
Build the five core RevOps metrics
The reporting tool you use will depend on the metric. Some can be tracked through HubSpot’s standard analytics reports, while others require the custom report builder, attribution reporting, or custom calculation properties.
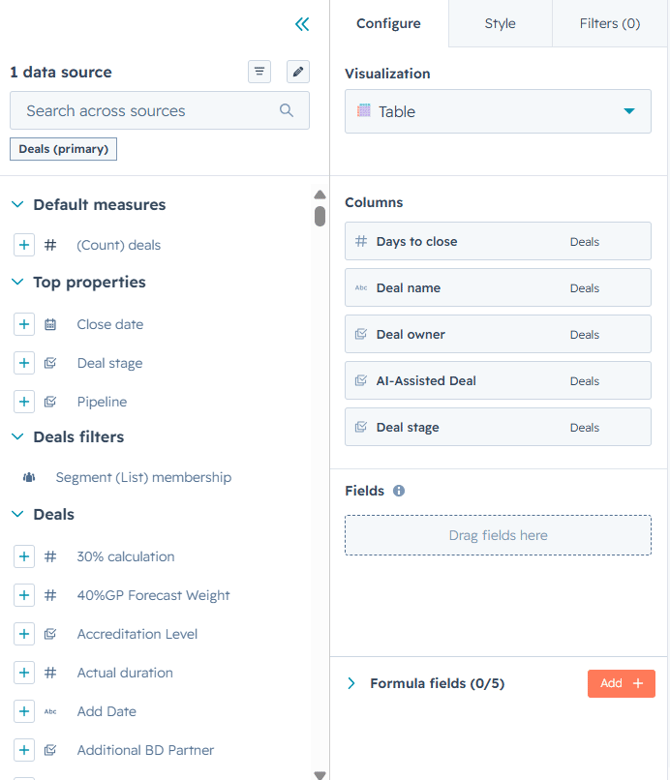
Use HubSpot’s custom report builder to select the data source, measures, properties, and filters required for each RevOps metric.
Metric 1: Deal Velocity / Time-to-Close
Goal: Measure how long deals take to close, then compare AI-assisted deals with non-AI deals.
Option A: Use the standard Sales Analytics report
If you want a quick starting point:
- Go to Reports.
- Open Sales Analytics:
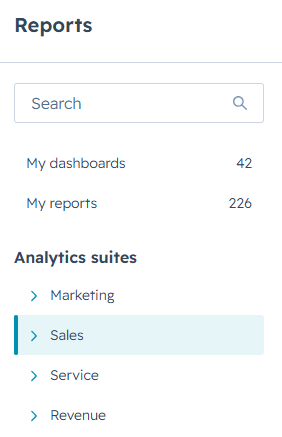
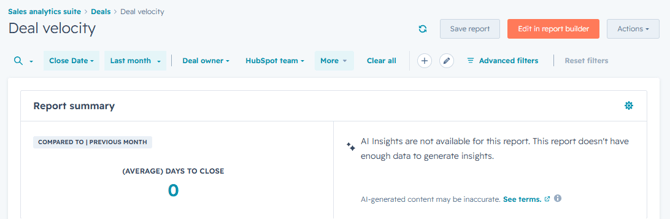
- Search for or select Deal velocity:
- Apply filters for:
- Date range
- Pipeline
- Rep or team
- Save the report.
- Add it to your dashboard.
This gives you the average number of days deals take to close.
Option B: Build a custom AI vs non-AI velocity report
If you want to compare AI-assisted deals against standard deals:
- Go to Reports.
- Click Create report.
- Choose Custom report.
- Select Deals as the primary data source.
- Click Next.
- In the report builder, add Days to close as the measure.
- Set the calculation to Average.
- Break down the report by AI-Assisted Deal.
- In the filters section, set:
- Close date = the reporting period you want
- Pipeline = the relevant pipeline
- Deal stage = closed won if you only want to measure successful sales cycles
- Choose a chart that makes comparison easy, such as a bar or column chart.
- Save the report as something like Deal Velocity: AI vs Non-AI.
What to check after building it: If AI-assisted deals close faster, the average Days to close should be lower for deals tagged AI-Assisted Deal = Yes.
Metric 2: Win Rate of AI-Assisted Deals vs Non-AI Deals
Goal: Compare outcomes, not just activity.
How to build the report
- Go to Reports.
- Click Create report.
- Choose Custom report.
- Select Deals as the primary data source.
- Click Next.
- Add these fields:
- Deal stage or deal status
- Amount
- Deal owner
- AI-Assisted Deal
- Add filters for:
- The date range you want
- The pipeline you want
- Closed-won and closed-lost deals only
- Use AI-Assisted Deal as the main category.
- Use Deal status as the breakdown.
- Use Count of deals as the core value.
- Choose a stacked bar or column chart and display the results as percentages.
- Save the report as Win Rate: AI-Assisted vs Non-AI Deals.
Metric 3: Revenue Per Rep / Efficiency Gains
Goal: Measure whether AI is helping each rep produce more revenue with the same capacity.
How to build the report
- Go to Reports.
- Click Create report.
- Choose Custom report.
- Select Deals as the primary data source.
- Click Next.
- Add these fields:
- Deal owner
- Amount
- Close date
- AI-Assisted Deal
- Filter for:
- Closed-won deals
- Your chosen date range
- Set the report to show:
- Total closed-won revenue by Deal owner
- Optionally, performance over time by month or quarter
- Save one version for all closed revenue.
- Save a second version filtered to AI-Assisted Deal = Yes.
If you want a fuller efficiency view, compare this report with active sales headcount data outside the report. Do not automatically use every paid HubSpot seat, as not all users are responsible for generating revenue.
Metric 4: Pipeline Contribution
Goal: Measure how much pipeline or revenue is associated with AI-supported acquisition and engagement.
Option A: Build a custom object-level report
If you simply want to know how much open or won pipeline is tagged as AI-influenced:
- Go to Reports.
- Click Create report.
- Choose Custom report.
- Select Deals as the primary data source.
- Add these fields:
- Amount
- Deal stage
- Close date
- AI-Assisted Deal
- Filter by pipeline and date range.
- Break down the report by AI-Assisted Deal.
- Use Sum of Amount as the value.
- Save the report as Pipeline Contribution: AI vs Non-AI.
This gives you a direct view of how much pipeline value is associated with AI-assisted deals. It does not prove that AI created or caused that pipeline.
Option B: Use attribution reporting
If you want to measure which tracked interactions, assets or campaigns contributed to contacts, deals or revenue:
- Go to Reports.
- Click Create report.
- Choose the Attribution report.
- Select the data source you need:
- Contacts for top-of-funnel influence
- Deals for deal-creation influence, if available
- Revenue for won-revenue influence, if available
- Choose the attribution model.
- Choose a dimension such as campaign, asset type, interaction source or deal owner.
- Apply filters for date range, lifecycle stage, interaction source or campaign.
- Save the report and add it to your dashboard.
Common mistakes to avoid
- Deals are not in a closed-won stage.
- Deals have missing Amount, Create date, or Close date values.
- Deals have no associated contact.
- Sales activities are logged to the contact but not associated with the deal.
- Teams expect attribution to include offline or untracked interactions that never entered HubSpot with the correct tracking or association data.
Metric 5: Cost Savings / ROI
Goal: Prove that AI is creating measurable financial value, not just operational activity.
Track the inputs needed to calculate ROI using custom properties on deals
Create these properties under Deal properties:
- AI Cost Allocated
- Estimated Hours Saved
- Estimated Cost Saved
- AI-Assisted Deal
Update those fields on AI-influenced deals.
Then:
- Go to Reports.
- Create a Custom report using Deals.
- Add these fields:
- Amount
- AI Cost Allocated
- Estimated Cost Saved
- Deal owner
- Close date
- Filter for the reporting period you want.
- Save separate reports for:
- AI-assisted revenue
- Estimated cost saved
- AI cost allocate
Practical ways to calculate ROI in HubSpot
You can model AI ROI in a few practical ways:
- Simple ROI model: Compare the incremental financial benefit associated with AI-assisted activity against the cost of the AI tools and implementation.
ROI (%) = (financial benefit − AI cost) ÷ AI cost × 100
- Efficiency model: Compare revenue per rep, time-to-close or the volume of opportunities handled before and after AI adoption.
- Cost-savings model: Estimate the hours saved by AI-assisted tasks and multiply them by a blended labour cost.
For more advanced calculations involving several records or data sources, you may need HubSpot datasets or an external reporting tool.
|
💡Important: These reports capture the inputs needed to measure ROI, but they don’t automatically calculate an ROI percentage. Where available, use a HubSpot calculated field or a dataset to complete the calculation. |
Step 4: Pull the reports into one dashboard
Once the five reports are built, bring them into one dashboard.
How to create a dedicated dashboard in HubSpot
- Go to Dashboards.
- Click Create dashboard in the upper-right corner.
- Name it AI ROI & RevOps Dashboard.
- Set visibility for the right team, leadership group, or business unit.
- Create the dashboard.
How to add reports to the dashboard
- Open the dashboard.
- Click Add content.
- Select Report.
- Hover over each saved report and click + Add.
- Arrange the layout so that the dashboard reads clearly from top to bottom.
A practical dashboard layout is:
- Top row: Deal velocity, win rate, and revenue per rep
- Middle row: Pipeline contribution and attribution
- Bottom row: ROI, cost savings, and notes or definitions
You can drag and drop reports to reorganise the dashboard.
Set up automated dashboard emails for stakeholders
Once the dashboard is live:
- Open the dashboard.
- Use the dashboard sharing or subscription options available in your portal.
- Choose the audience.
- Set a weekly or monthly cadence.
- Use a clear dashboard name, so recipients know exactly what they’re receiving.
Note: HubSpot supports daily, weekly, and monthly recurring dashboard emails, but recurring emails are limited to users in the account.
Frequently Asked Questions
What are the default HubSpot lifecycle stages?
HubSpot’s default lifecycle stages are Subscriber, Lead, Marketing Qualified Lead, Sales Qualified Lead, Opportunity, Customer, Evangelist, and Other.
It’s also important to understand how lifecycle stages behave in HubSpot. They generally move forward automatically rather than backwards, and HubSpot can update lifecycle stages when a deal is created or won. Contact and company lifecycle stages can also be synced when configured. This means lifecycle stages don’t just define where someone sits in the customer journey; they can also influence automation and reporting across your portal.
How do B2B SaaS companies structure HubSpot lifecycle stages?
Marketing usually owns the journey from Subscriber to Marketing Qualified Lead, while sales typically owns Sales Qualified Lead through to Customer. Customer success then tracks onboarding, adoption, renewals, and expansion using additional properties or pipelines.
Should you use native HubSpot reporting or custom RevOps dashboards?
Start with HubSpot’s native reports because they are quicker to build and easier to maintain. Use custom reports or datasets when you need more advanced calculations, multiple data sources or finance information that is not stored directly in HubSpot.
How can you calculate CAC and LTV using HubSpot?
HubSpot can provide lead-source, lifecycle, customer and revenue data, while cost and margin information may come from finance, advertising or billing systems. Connect or export the data, apply your agreed CAC and LTV formulas, and validate the final figures with finance.
What helps improve pipeline velocity and prevent deal slippage?
Keep deal stages clearly defined, require accurate amounts and close dates, and regularly review deals with no recent activity or overdue close dates. Consistent pipeline hygiene makes HubSpot RevOps reporting more reliable and helps teams identify stalled opportunities sooner.
How do you set up custom reporting in HubSpot?
Go to Reporting > Reports, click Create report and select Custom report. Choose your primary data source, add the required fields and filters, select a visualisation, then save the report to your reports list or dashboard.